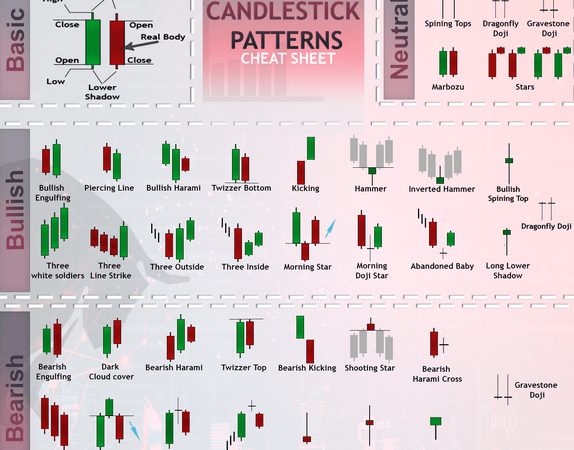
Candlestick Patterns
What are Candlesticks Patterns?
Candlestick patterns are a popular tool used in technical analysis to analyze price charts and make predictions about future price movements of financial assets, such as stocks, currencies, commodities, and more. These patterns are formed by the arrangement of one or more candlesticks, each representing a specific time period (e.g., a day, an hour, etc.).
Candlesticks Patterns are a technical analysis tool that traders use to chart and analyze the price movement of securities. The concept of candlestick charting was developed by Munehisa Homma, a Japanese rice trader. During routine trading, Homma discovered that the rice market was influenced by the emotions of traders, while still acknowledging the effect of demand and supply on the price of rice.
Candlestick Patterns
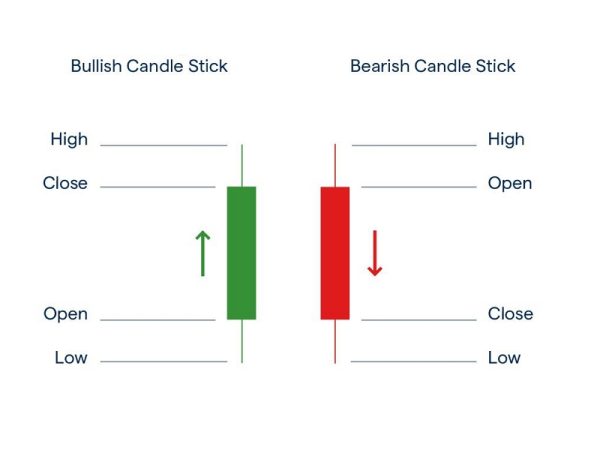
The Japanese have been using candlesticks to trade commodities since the 17th century which makes them the first and most basic form of Technical Analysis. Candlesticks remain popular even today as they are a visually appealing way to monitor price data. The body of a candle is created by the difference between the open and close (also referred to as “the real body”), while the thin “shadows” on either end of the candle mark the high and low over that period (also referred to as “wicks” or “tails”). A dark or red candle means the close was below the open, while a white, green or blue candle shows the price closed higher than it opened.
Bullish Candlestick Patterns
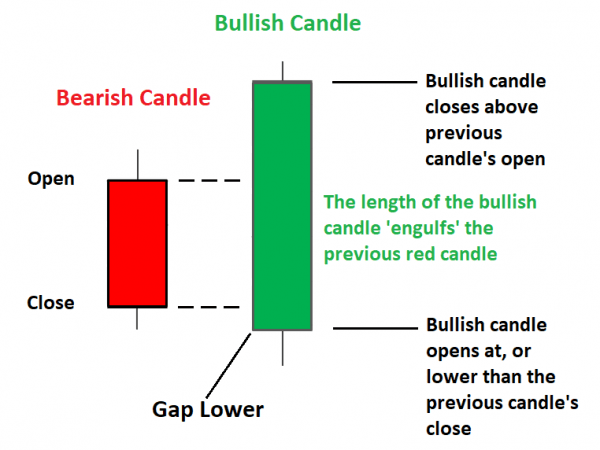
Bullish Engulfing Pattern
The bullish engulfing pattern is a reversal candlestick pattern that suggests the end of a downtrend. It presents as a large bullish candle that ‘engulfs’ the previous candle. The bullish engulfing is a significant price action signal when it occurs at key levels in the stock market. These key levels include support levels, demand zones, trend lines, etc.
For a bullish engulfing to be valid, it should have a high volume indicated by the volume bars, and its body should completely engulf that of the previous candle. This is important to note while trading this price action signal.
The psychology behind the formation of this pattern is the fact that buyers come in at key levels. As such, the volume of their trades increases the buying pressure and causes the bullish candle to engulf the previous candle; as a sign of strength or significant buying pressure.
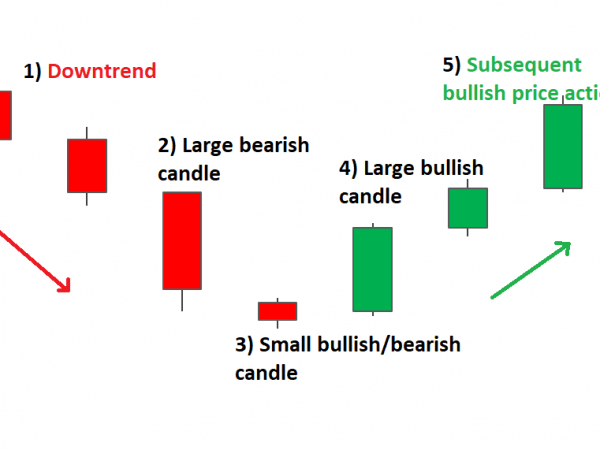
Morning Star
The morning star is a 3-candle pattern that can be used to forecast bullish reversals with a significant degree of accuracy. The first candlestick is usually bearish with a medium-sized or large candle body. This shows the presence of sellers in the market.
The second candle is small-sized, preferably one with a small body. This shows the reduction in selling pressure as buyers come into the market.
The third candle is a bullish candle, preferably one with a large body that engulfs the preceding small candlestick. The psychology behind the formation of this pattern is the transition of the market from being bearish to bullish.
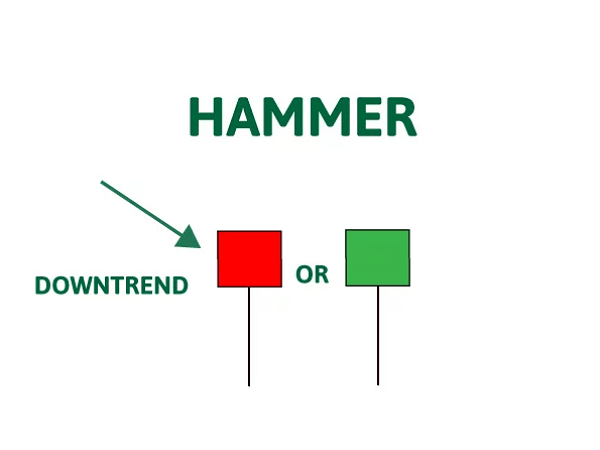
Hammer & Inverted Hammer
The hammer and inverted hammer are unique candlestick patterns that appear to be opposites but actually show a bullish reversal. The hammer, as the name suggests, is shaped like a hammer. The lower part of this candle is a wick of considerable length, while the upper part is the candle body. In other words, the candlestick has a long wick and a small upper body.
The inverted hammer is like an inverted version of the hammer. It is a candlestick with a long upper wick and a small lower body.
While trading the hammer or inverted hammer, the type of candle body isn’t significant. This means that the hammer could close as a long wick with a small bearish body yet remain valid. To help you understand this, let’s discuss the psychology of the hammer’s formation.
The long wick shows rejection of a key level. Rejection in stock trading is simply the inability of sellers to move prices lower. As such, buyers come in and push prices upwards, leading to a rejection and the formation of a long wick.
Now I’m sure you are wondering why the inverted hammer is a bullish pattern despite its long upper wick. Well, it’s considered a bullish candlestick pattern because the small lower body shows the reduction in selling pressure as buyers enter the market.
Bullish Harami
The bullish harami is a notable bullish reversal pattern that’s often regarded as the opposite of the bullish engulfing pattern. It is formed by two candlesticks; a large bearish candle followed by a small bullish one.
The bullish candle should be small enough to ‘fit’ into the bearish candle because its open, close, high, and low will be within the range of the bearish candle. This is a crucial factor to consider before trading this pattern.
When the bullish harami appears, you can confirm the reversal using various tools such as market structure and oscillators. Most traders wait for the formation of a higher high (also called a break of market structure) before entering trades. This pattern is backed by the belief that the small bullish candle appears because sellers have become exhausted by failing to push prices lower.

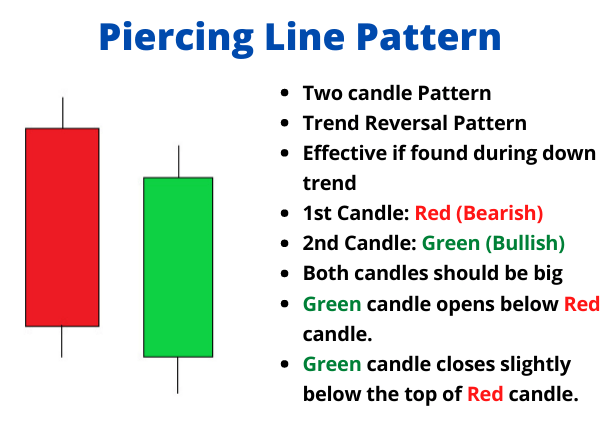
Piercing Line
The piercing line pattern is formed by two candlesticks and suggests a bullish reversal. The first candle is a bearish candle, while the second is bullish. The bullish candle gaps lower by opening at a price lower than the close of the preceding bearish candle and then closes above the midpoint of the bearish candle.
While using this pattern, note the length of the candle as this is crucial to applying it correctly. Both candles should have large bodies, and the probability of success is increased if the pattern appears at key price levels.
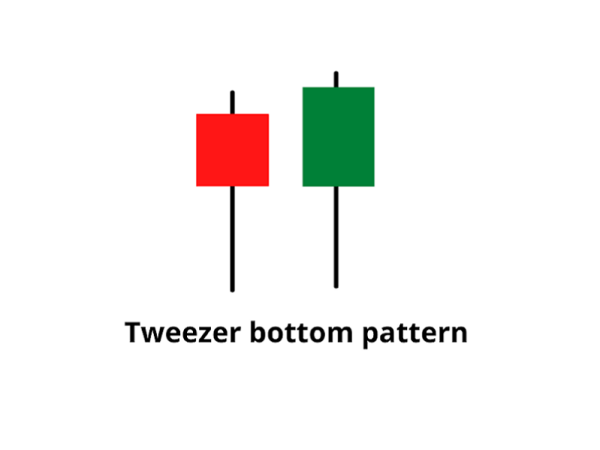
Tweezer Bottoms
Tweeter bottoms are widely traded bullish patterns that can be used to trade different assets, including stocks. It’s a simple pattern made up of two candles, a bearish candle followed by a bullish one, and both should be of comparable size. The bullish candle should open at the close of the bearish one, and both candles should have significant volumes. The closing price of the bullish candle should be at or above the opening price of the bearish candle.
This pattern is often spotted at the bottom of a downtrend. Since the size of both candles is similar, it suggests that the selling pressure in the bearish candle was matched by the buying pressure of the bullish candle. This shows the downtrend could reverse.
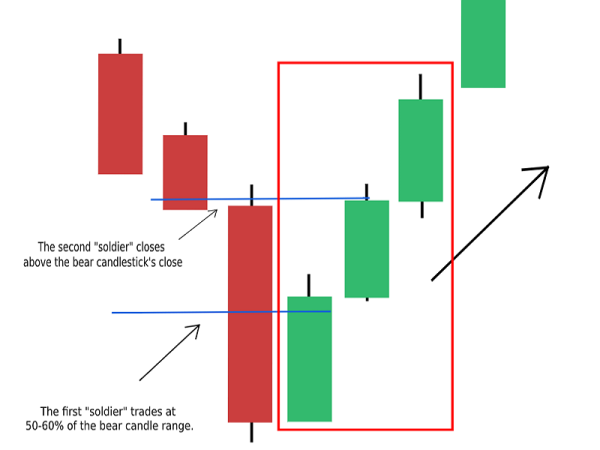
Three White Soldiers
The three white soldiers are simply three consecutive bullish candles which show that buyers have entered the market with a considerable amount of buying pressure. This pattern can be traded with other price action indicators like trend lines and the Fibonacci retracement tool.
While using this pattern, note that the size of the candles, as well as the candle bodies, are significant. The candle volume is indicated by volume indicators found on charting platforms. Since the candles show an influx of buyers or ‘buy’ orders, they should have large bodies and minimal wicks. Before establishing the formation of this pattern, wait for the candles to close as bullish candles.
Bullish Marubozu
The Bullish Marubozu is a single candlestick pattern that is formed after a downtrend indicating a bullish reversal. This candlestick has a long bullish body with no upper or lower shadows which shows that the bulls are exerting buying pressure and the markets may turn bullish.

Bearish Candlestick Patterns
Evening Star
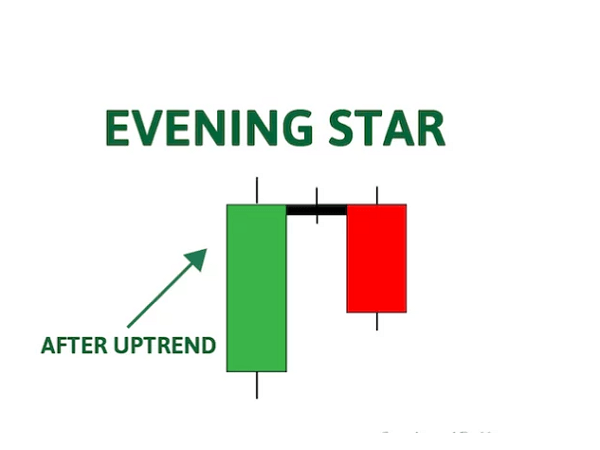
The Evening Star
The evening star pattern is the upside-down version of the morning star pattern. It indicates the reversal of an uptrend into a downtrend. The three candlesticks are characterized as follow:
The first candlestick is a bullish candlestick with relatively small shadows.
The second candlestick has a small green or red body and short shadows.
The third candlestick is a bearish candle, and the body is bigger than the first one (or at least the same size).
Dark Cloud Cover
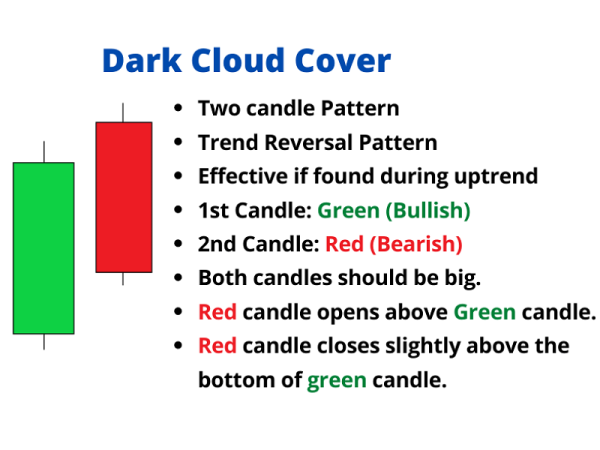
The dark cloud cover “phenomenon” signals the potential end of an uptrend. It is a two-candle pattern where the first candle is a long green candlestick, followed by a long red candlestick that opens above the previous candlestick’s close. During its trading period, the price starts to decline significantly and the red candlestick closes below the midpoint of the first candlestick’s body.
This pattern suggests that the sunny days of the current uptrend are coming to an end. Bulls are losing control, and the bears are taking over.
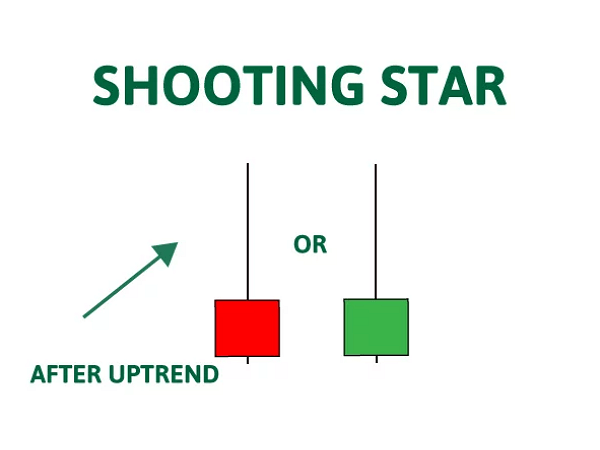
Shooting Star
The shooting star is the opposite of an inverted hammer. It consists of a red candle with a short body and a long upper shadow. Generally, the market will gap a bit higher on the candlestick opening and will surge to a local peak before closing just below the open. The body can sometimes be almost nonexistent.
Bearish Harami
The Bearish Harami is a multiple candlestick pattern formed after the uptrend indicating bearish reversal.
It consists of two candlesticks, the first candlestick being a tall bullish candle and second being a small bearish candle which should be in the range of the first candlestick chart.
The first bullish candle shows the continuation of the bullish trend and the second candle shows that the bears are back in the market.

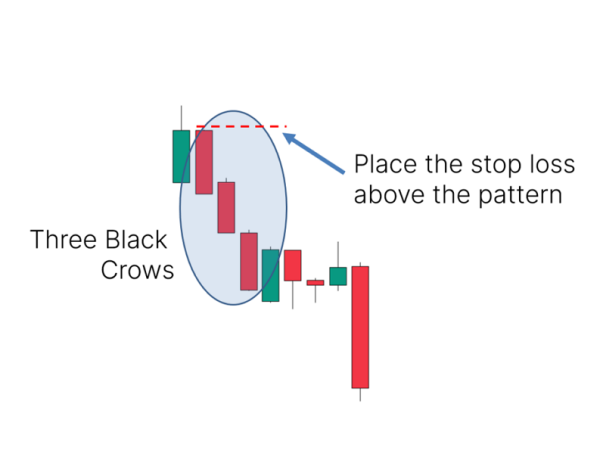
Three Black Crows
The three black crows pattern is a bearish reversal pattern that is more accurate when it forms at the end of an uptrend. Think of it as an upside down three white soldier’s pattern.
This pattern is formed by three consecutive bearish candlesticks. The opening of each candlestick occurs at the previous candlestick’s closing price, and the closing price is lower than the opening price. The three black crows pattern is particularly significant when it occurs at higher price levels or after a mature advance, indicating a potential decline in prices.
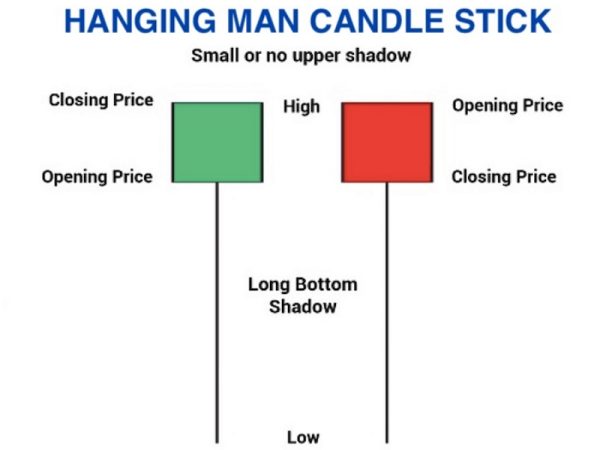
Hanging Man
The hanging man pattern is a bearish signal. The shape of the Hanging Man candlestick resembles a person hanging by their feet, hence the name. It typically occurs after an uptrend in the market and suggests that the bullish momentum may be weakening or reversing. The hanging man candlestick has a small body positioned at the top of the candle and a long lower shadow. The lower shadow must be at least twice as long as the candle’s body, and there must be a small or no upper shadow.
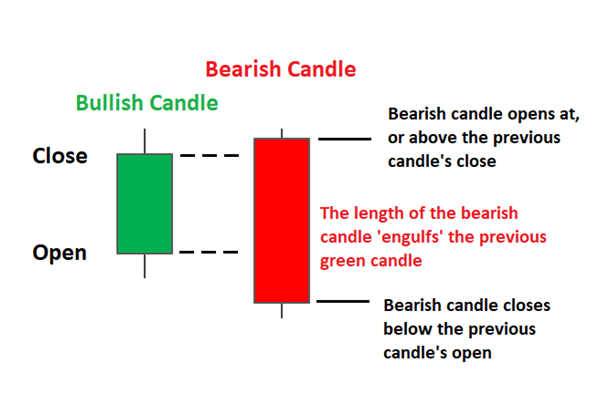
Bearish Engulfing
The bearish engulfing pattern is the inverted version of a bullish engulfing, so the first candle has a small green body and is completely covered by the next long red candle. This pattern comes at the peak of an uptrend and suggests a reversal. The lower the second candle continues, the more momentum the bearish move will have.
Tweezer Top
The Tweezer Top pattern is a bearish reversal candlestick pattern that is formed at the end of an uptrend.
It consists of two candlesticks, the first one being bullish and the second one being bearish candlestick. Both the tweezer candlestick make almost or the same high.
When the Tweezer Top candlestick pattern is formed the prior trend is an uptrend. A bullish candlestick is formed which looks like the continuation of the ongoing uptrend.
On the next day, the high of the second day’s bearish candle’s high indicates a resistance level. Bulls seem to raise the price upward, but now they are not willing to buy at higher prices.

Bearish Marubozu
The Bearish Marubozu is a single candlestick pattern which is formed after an uptrend indicating bearish reversal.
This candlestick chart has a long bearish body with no upper or lower shadows which shows that the bears are exerting selling pressure and the markets may turn bearish. At the formation of this candle, the buyers should be caution and close their buying position.
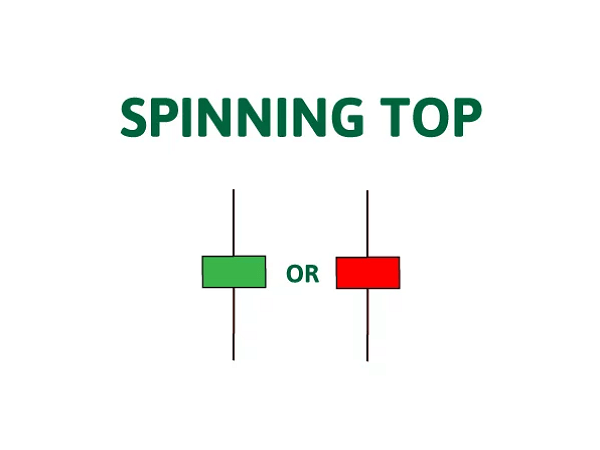
Spinning Top
Like doji, the spinning top is a candlestick with a short body. However, the two shadows are of equivalent length with the body in the middle. This pattern also indicates indecision, and may suggest a period of rest or consolidation after a significant rally or price decline.
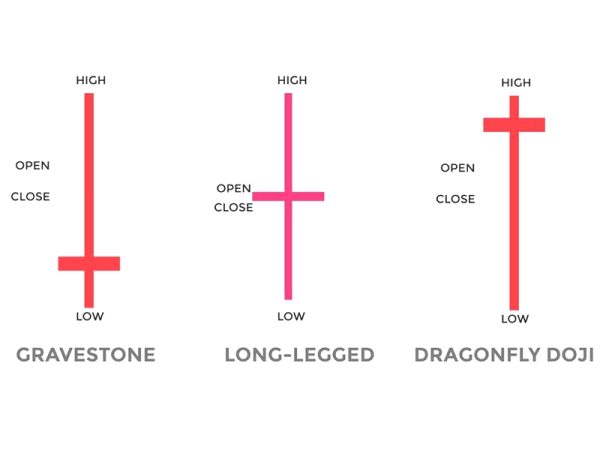
Doji
The term “doji” in Japanese translates to “the same thing,” and it refers to the candlesticks with the open and close prices more or less the same. The length of the upper and lower shadows can vary.
A classic doji pattern is a candlestick pattern that indicates indecision and uncertainty in the market. The pattern indicates that neither the buyers nor sellers are in control and that the market is in a state of equilibrium. Traders interpret the presence of a doji pattern as a signal to exercise caution and await further confirmation or additional information before making any decisive buying or selling decisions.
There are different types of doji patterns, including the classic doji (which was described above), gravestone doji, and dragonfly doji. Each type of doji pattern has its own unique characteristics and interpretation.
Gravestone doji and dragonfly doji are very similar to the bearish and bullish pin bar patterns except for the size of the body. A doji candlestick has no body, meaning that the opening and closing prices are virtually the same, while a pin bar possesses a small body.
It’s important to note that while candlestick patterns can provide valuable insights into market sentiment and potential price movements, they should be used in conjunction with other technical analysis tools and indicators for more accurate predictions. Additionally, no pattern guarantees a specific outcome, and risk management is crucial when making trading decisions.