Elliot wave Principles
Introduction To Elliott Wave Theory
Elliott Wave Principles, Elliott Wave Theory, or Elliott Waves was discovered by Ralph Nelson Elliott. He developed the analytical tools in the 1930s, and utilized understanding of crowd psychology and social trends to chart.
Elliott developed a rational system of market analysis. He proposed that market prices unfold in specific patterns, and isolated 13 patterns of movements that recur in the market price and are repetitive but not necessarily in time or altitude.
He named, defined and illustrated the patterns and linked them together to form a larger version of those same patterns. These patterns, in turn, link to form identical patterns of the next larger size.
According to Elliott wave theory, after conducting technical and behavioral analysis, several models can be built at extreme points, according to which price movement of the underlying asset shortly is determined.
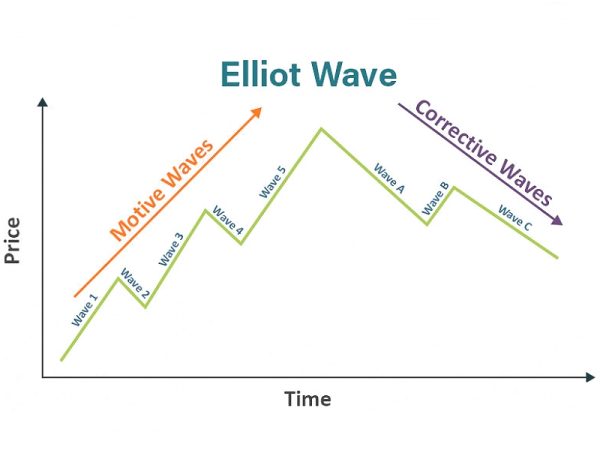
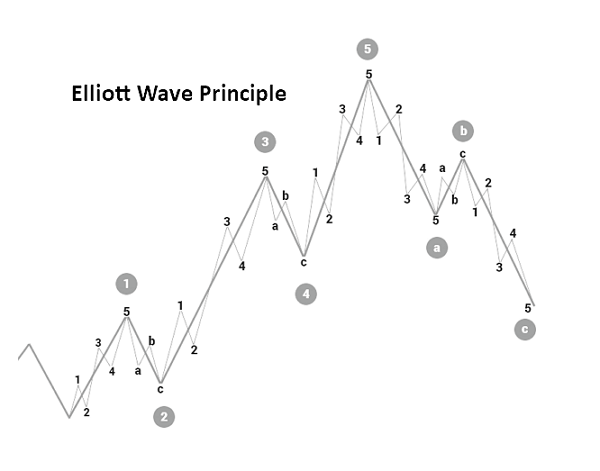
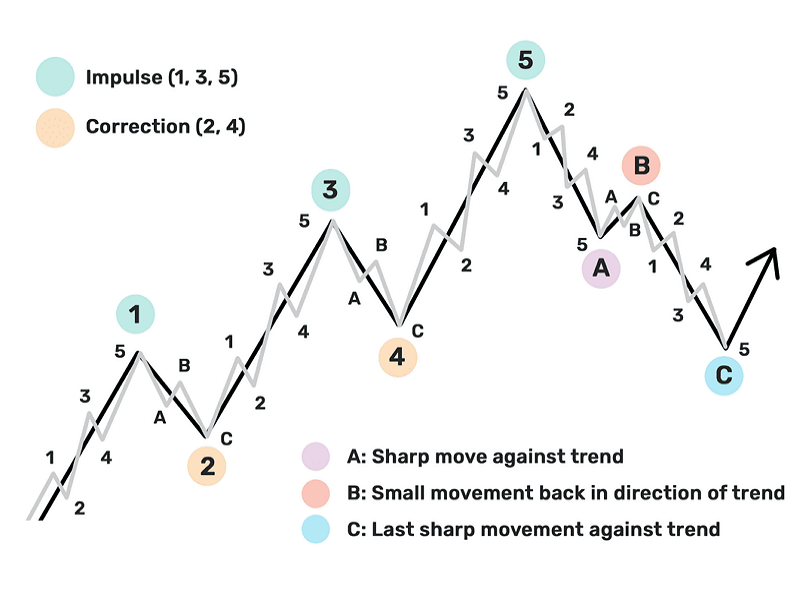
The theory suggests that any major market move is a cyclical in nature, 5 cycles in the direction of the dominant trend and 3 against the trend.
The 5 waves are called Motive cycles and the other 3 are Corrective. This modeling significantly increase the probability of an accurate forecast with timely entry and exit from the market trend.
That is why the Elliott wave theory is considered as an effective tool for technical analysis of markets.
Elliott Wave Theory
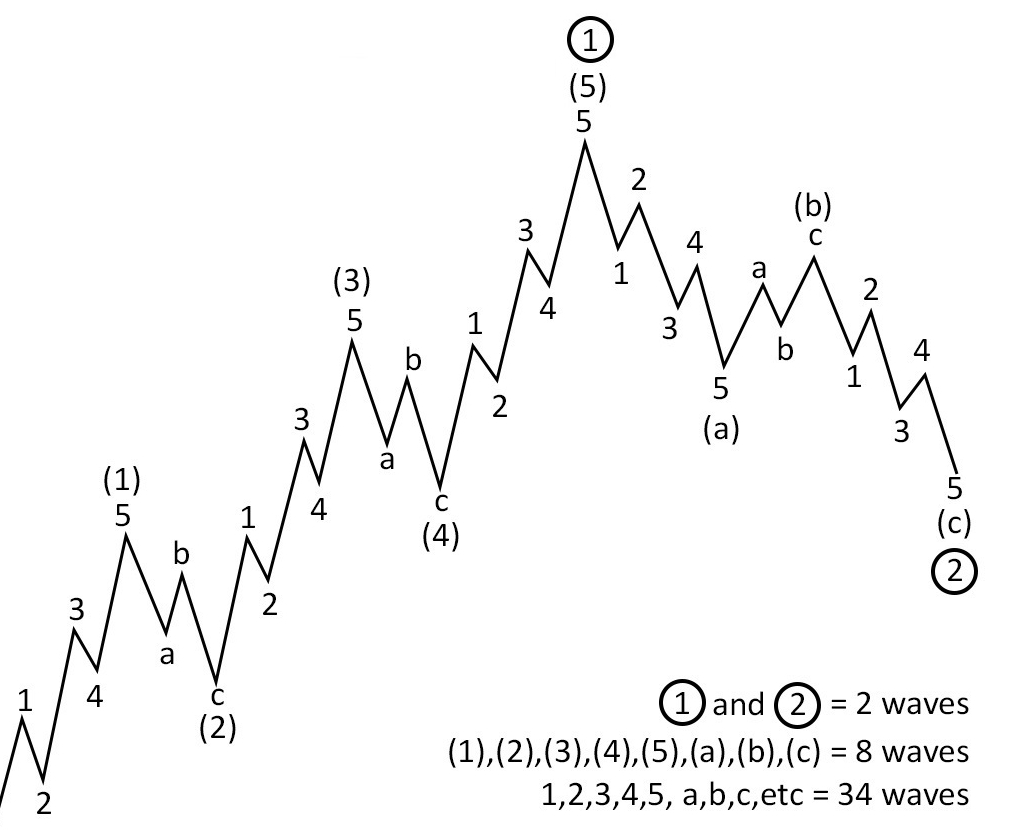
Elliott Wave theory is one of the most accepted and widely used forms of technical analysis. It describes the natural rhythm of crowd psychology in the market, which manifests itself in waves. The essence of Elliott waves is that prices alternate between impulsive phases that establish the trend and corrective phases that retrace the trend. In their most basic and straightforward form, impulses contain 5 lower degree waves and corrections contain 3 lower degree waves.
Elliott Wave is fractal and the underlying pattern remains constant. The 5 + 3 waves define a complete cycle. They can form different patterns such as ending diagonals, expanded flats, zigzag corrections and triangles. Fifteen different degrees of waves can be identified with each of the 5 smart drawing tools, allowing users to visually identify different degrees of waves on a chart. The key to trading Elliott waves successfully is counting them correctly for which there are rules and guidelines.
Elliott Wave Principle
The Elliott Wave Principle is a detailed description of how groups of people behave. It reveals that mass psychology swings from pessimism to optimism and back in a natural sequence, creating specific and measurable patterns.
One of the easiest places to see the Elliott Wave Principle at work is in the financial markets, where changing investor psychology is recorded in the form of price movements. If you can identify repeating patterns in prices, and figure out where we are in those repeating patterns today, you can predict where we are going.
The Elliott Wave
Using the Elliott Wave Principle is an exercise in probability. An Elliottician is someone who is able to identify the markets structure and anticipate the most likely next move based on our position within those structures. By knowing the wave patterns, you’ll know what the markets are likely to do next and (sometimes most importantly) what they will not do next. By using the Elliott Wave Principle, you identify the highest probable moves with the least risk.
The Elliott Wave Principle is a theory developed by Ralph Nelson Elliott in the 1930s. It suggests that stock market prices unfold in specific patterns, which are driven by investor psychology and market sentiment.
Motive & Corrective Waves
Elliott’s pattern consists of motive waves and corrective waves. A motive wave is composed of five subwaves and always moves in the same direction as the trend of the next larger size. A corrective wave is divided into three subwaves and it moves against the trend of the next larger size.
Motive Or Impulse
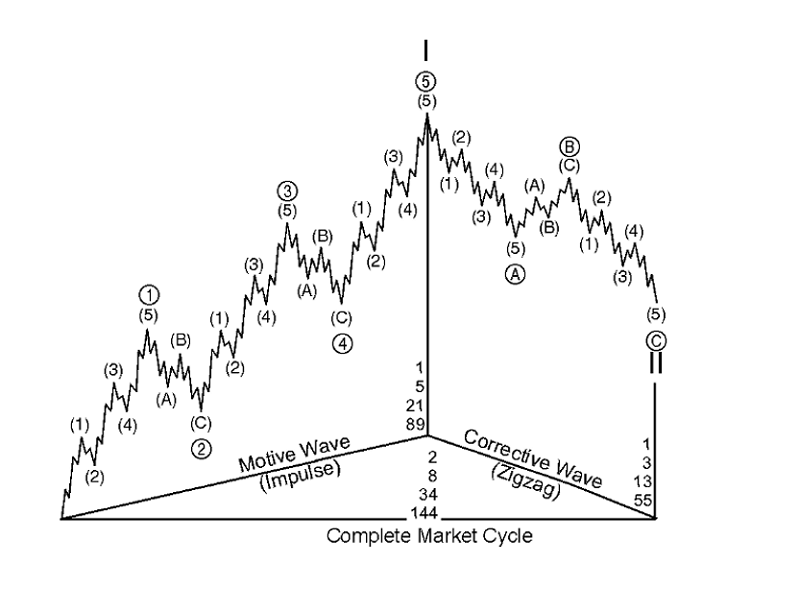
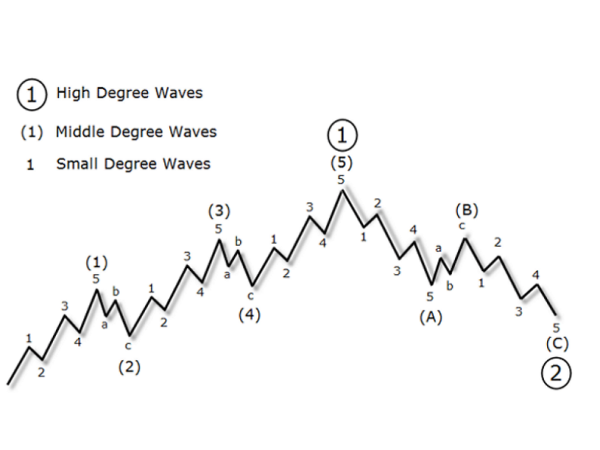
Waves (1), (2), (3), (4) and (5) together complete a larger impulsive sequence, labelled wave [1]. The impulsive structure of wave [1] tells us that the movement at the next larger degree of trend is also upward. It also warns us to expect a three-wave correction — in this case, a downtrend. That correction, wave [2], is then followed by waves [3], [4] and [5] to complete an impulsive sequence of the next larger degree, labelled as wave one. At that point, again, a three-wave correction of the same degree occurs, labelled as wave two.
Within a corrective wave, subwaves A and C are usually smaller-degree impulsive waves. This means they too move in the same direction as the next larger trend. Note that because they are impulsive, they themselves are made up of five subwaves. Waves labelled with a B, however, are corrective waves; they move in opposition to the trend of the next larger degree. These corrective waves are themselves made up of three subwaves.
wave 1 must be an impulse or a leading diagonal
wave 2 can be any corrective pattern except a triangle and must not retrace more than 100% of wave 1
wave 3 must be an Impulse and must be longer than wave 2 and wave 3 should never be the shortest wave when compared to waves 1 and 5
wave 4 can be any corrective pattern (zig-zag, double or triple zig-zag, triangle, flat, double or triple three) and wave 4 should never trade into a territory of wave 1
wave 5 must be an impulse or an ending diagonal
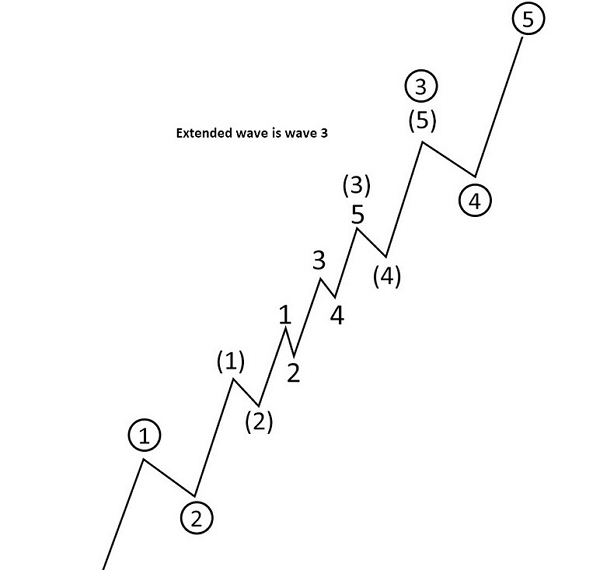
Extended Wave 3
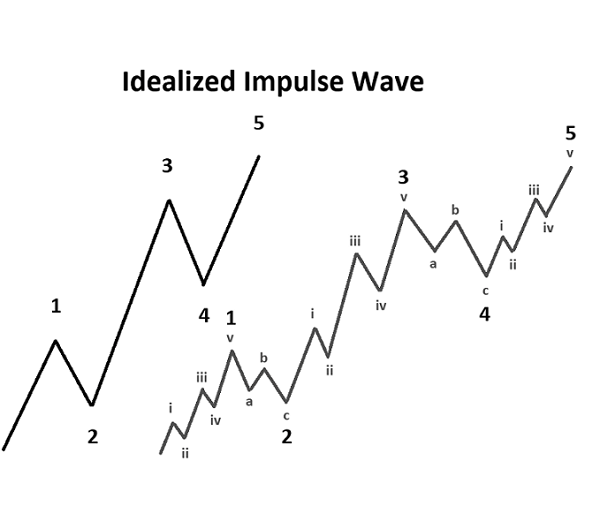
Most impulses contain what Elliott called an extension. An extension is an elongated impulse with exaggerated subdivisions. The vast majority of impulses contain an extension in one and only one of their three actionary subwaves.
The fact that extension typically occurs in only one actionary subwave provides a useful guide to the expected lengths of upcoming waves. For instance, if the first and third waves are about equal length, the fifth wave will likely be a protracted surge. Conversely, if wave three extends, the fifth should be simply constructed and resemble wave one. In the market, the most commonly extended wave is wave 3.
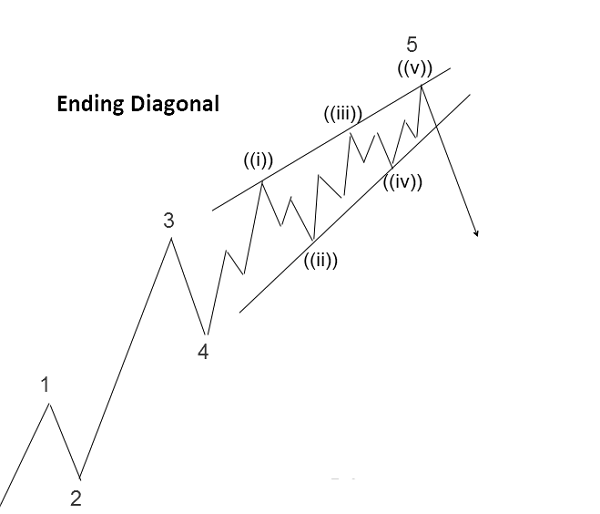
DIAGONAL TRIANGLE (Ending Diagonal)
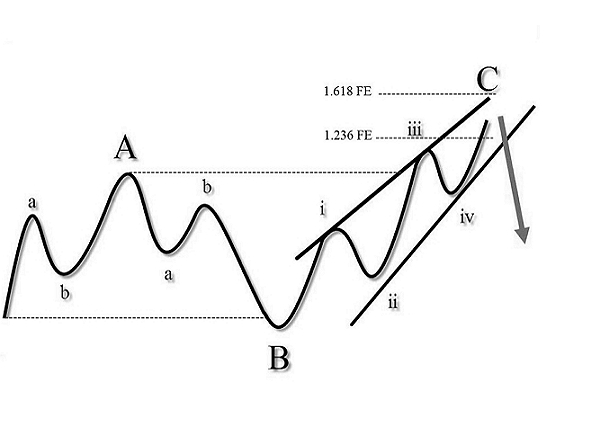
A Diagonal is a common 5-wave motive pattern labelled 1-2-3-4-5 that moves with the larger trend. Diagonals move within two contracting channel lines drawn from waves 1 to 3, and from waves 2 to 4. There are two types of diagonals: leading diagonals and ending diagonals. They have a different internal structure and are seen in different positions within the larger degree pattern. Ending diagonals are much more common than leading diagonals.
An ending diagonal is a special type of pattern that occurs at times when the preceding move has gone too far too fast, as Elliott put it. A very small percentage of ending diagonals appear in the C wave position of A-B- C formations. In double or triple threes, they appear only as the final “C” wave. In all cases, they are found at the termination points of larger patterns, indicating exhaustion of the larger movement.
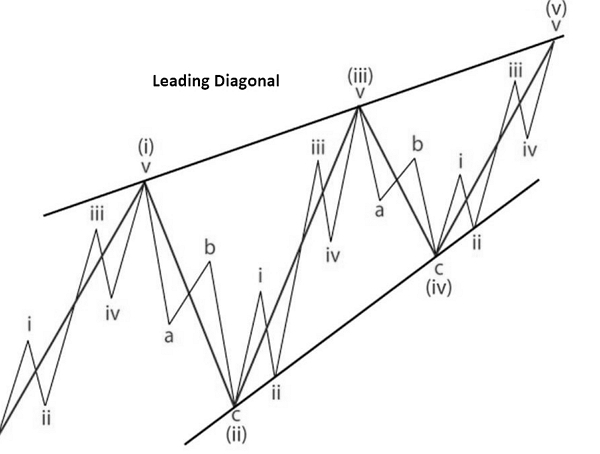
DIAGONAL TRIANGLE (Leading Diagonal)
When diagonal triangles occur in the fifth or C wave position, they take the 3-3-3-3-3 shape that Elliott described. However, it has recently come to light that a variation on this pattern occasionally appears in the first wave position of impulses and in the A wave position of zigzags. The characteristic overlapping of waves one and four and the convergence of boundary lines into a wedge shape remain as in the ending diagonal triangle. However, the subdivisions are different, tracing out a 5-3-5-3-5 pattern.
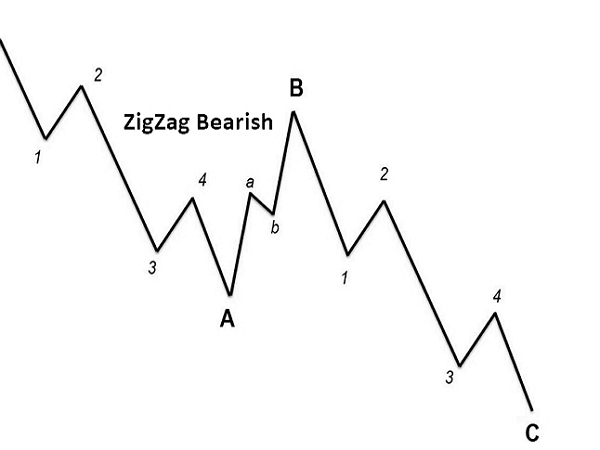
Zig-Zag
A Zig-Zag is a 3-wave structure labeled A-B-C, generally moving counter to the larger trend. It is one of the most common corrective Elliott patterns. Corrective patterns are labeled with letters, and move against the larger trend
Structure is 5-3-5. Wave A must be a motive wave. Wave B can only be a corrective pattern. Wave B must be shorter than wave A by price distance. Wave C must be a motive wave.
It appears in Wave 2 or 4 in an impulse, Wave B in an A-B-C, Wave X in a double or triple Zig-Zag, or Wave Y in a triple three
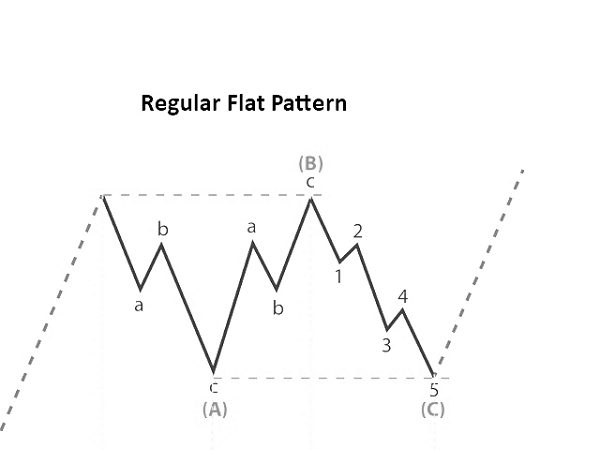
Flat (Regular, Expanded & Running)
A Flat is a three-wave pattern labeled A-B-C that generally moves sideways. It is corrective, counter-trend and is a very common Elliott pattern.
Structure is 3-3-5. Wave B terminates about at the level of the beginning of wave A. Wave C terminates a slight bit past the end of wave A. It appears in wave two or four in an impulse, wave B in an A-B-C, wave X in a double or triple zig-zag, or wave Y in a triple threes
Expanded Flat
Structure is 3-3-5. Wave B terminates well beyond the beginning of wave A as in an expanded flat. Wave C fails to travel its full distance, falling short of the level at which wave A ended. It appears in wave two or four in an impulse, wave B in an A-B-C, wave X in a double or triple zig-zag, or wave Y in a triple threes