Technical Analysis
What is Technical Analysis
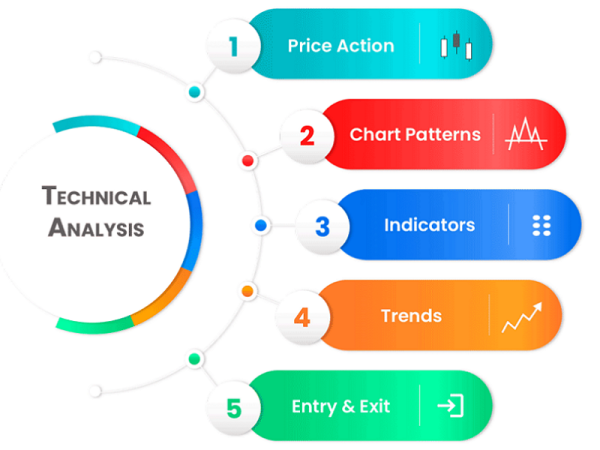
Technical analysis is a trading tool employed to evaluate securities and attempt to forecast their future movement by analyzing statistics gathered from trading activity, such as price movement and volume. Unlike fundamental analysts who attempt to evaluate a security's intrinsic value, technical analysts focus on charts of price movement and various analytical tools to evaluate a security's strength or weakness and forecast future price changes.
Over the years, numerous technical indicators have been developed by analysts in attempts to accurately forecast future price movements. Some indicators are focused primarily on identifying the current market trend, including support and resistance areas, while others are focused on determining the strength of a trend and the likelihood of its continuation.
Historical Data
Technical analysis is the study of historical price action in order to identify patterns and determine probabilities of future movements in the market by studying price action and through the use of technical indicators and chart patterns.
Technical Analysis focuses on using a price chart to identify the trend, support and resistance, and momentum to help traders get into and out of higher probability trades.
A technical analyst believes that prices move in trends, and price movements generally follow established patterns that can be partly attributed to market psychology based on the widely-held belief that participants in markets react in a similar fashion when faced with similar situations.
Technical analysis does not attempt to measure an asset’s underlying value, but rather, uses price charts and technical indicators to identify patterns that can be used as a basis for trade entries and exits.

Patterns Tend To Repeat
Forex traders who use technical analysis believe that price patterns tend to repeat themselves in the future, they’ll analyze a currency pair’s previous price movements, and use those to decide when to enter and exit positions.
The overarching principle of technical analysis is that an asset’s price already reflects all available information and instead focuses on the statistical analysis of price movements.
It boils down to an analysis of supply and demand in the market to determine where the price trend is headed.
The main theory of technical analysis is:
Recent price developments allow you to understand what the buyers and sellers on the market are thinking.
You can then tell whether it is buying or selling interest that is increasing.
This allows you to deduce what the market participants may do next.

The Theory
Technical analysis is based on the theory that the markets are chaotic (no one knows for sure what will happen next), but at the same time, price action is not completely random.
Within a state of chaos, there are identifiable patterns that tend to repeat.
This means that successful trading using technical analysis is NOT about being right or wrong
It is about determining probabilities and taking trades when the odds are in your favor.
Part of determining probabilities involves trying to determine future price direction and when/where to enter into a position.
But equally important is determining your risk-to-reward ratio.
There’s no magical combination of technical indicators that will unlock some sort of secret trading strategy.
The secret of successful trading is good risk management, discipline, and the ability to control your emotions.
Anyone can guess right and win every once in a while, but without risk management, it is virtually impossible to remain profitable over time.
Technical Indicators
Technical analysis is the study of historical price action to identify patterns and determine probabilities of future movements in the market by studying price action and through the use of technical indicators and chart patterns.
Technical Indicator
Technical Indicator
A technical indicator is a mathematical calculation that can be applied to price and volume data. It can be even applied to another technical indicator.
The result is a value that is used to anticipate future changes in prices.
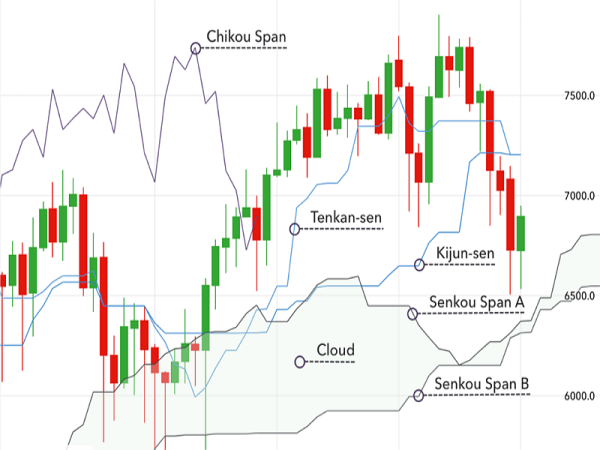
Technical indicators are the squiggly lines found above, below, and on top of the price information on a chart.
They are used by forex traders who follow technical analysis.
A technical indicator offers a different perspective from which to analyze the strength and direction of the underlying price action.
By analyzing historical data, technical analysts use indicators to predict future price movements
Categories of Technical Indicators
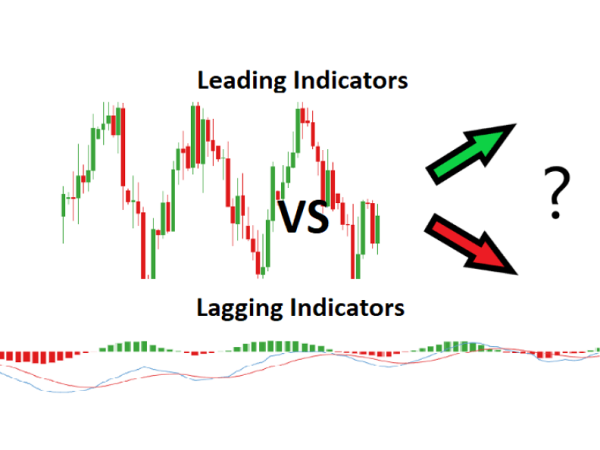
Leading & Lagging Indicators
Leading indicators try to predict price by using a shorter period in their calculation, which leads the price movement. The most popular leading indicators are MACD, RSI, and Stochastic. These indicators typically work by measuring how “overbought” or “oversold” an asset is. The assumption is that when something is “oversold” it will bounce back.
LAGGING indicators give a signal after the trend or reversal has started. The most common lagging indicator is the Moving Average. They don’t warn you of upcoming changes in prices, they simply tell you what prices are doing (rising or falling) so that you can trade accordingly. Lagging indicators have you buy and sell late, but in exchange for missing the early opportunities, they greatly reduce your risk by keeping you on the right side of the market. The general approach is that you should use lagging indicators during trending markets and leading indicators during sideways markets.
Types of Technical Indicators
Trend Following Indicators
Trend-Following Indicators
Trend following indicators help traders trade currency pairs that are trending up or trending down.
These indicators can help point out the direction of the trend and can tell us if a trend actually exists.
Trend-following indicators measure the direction and strength of a trend, using some form of price averaging.
As price moves above the average, it is considered to be in a bullish trend. When price moves below the average, it signals a bearish trend.
Here are examples of trend-following indicators:
• Moving averages are used to identify current trends, as well as support and resistance levels.
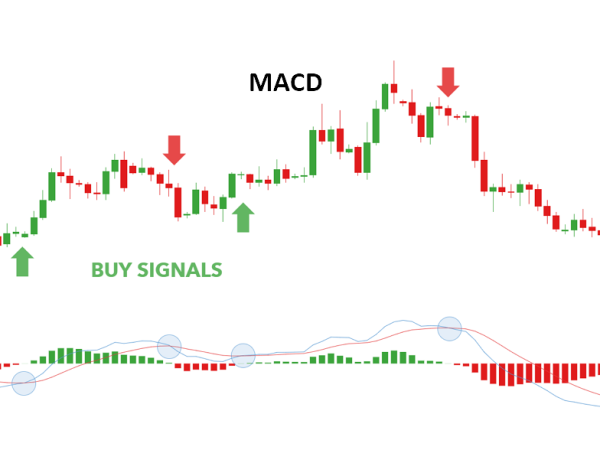
• MACD is used to reveal changes in the strength, direction, momentum, and duration of a trend.
• Parabolic SAR is used to find potential reversals in the price’s direction.
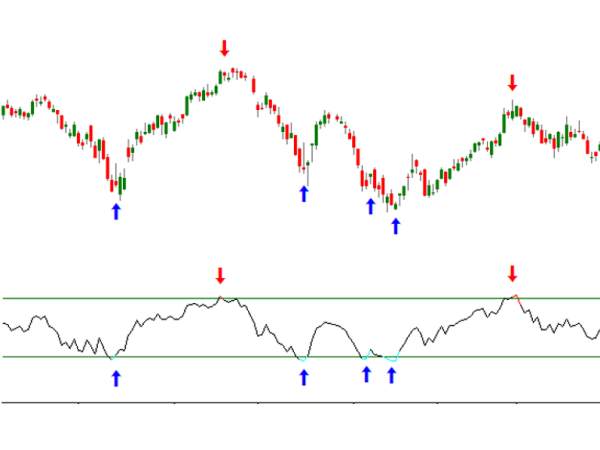
Momentum Indicators
Momentum indicators help identify the speed of price movements by comparing prices over time. It can also be used to analyze volume.
It is calculated by comparing the current closing price to previous closing prices.
Typically, this appears as a line below a price chart that oscillates as momentum changes.
When there is a divergence between price and a momentum indicator, it can signal a change in future price direction.
Here are examples of momentum indicators:
• Stochastic shows the location of the closing price relative to the high-low range over a set number of periods.
• CCI is an oscillator that helps identify cyclical turns or trend reversals.
• RSI measures the strength or weakness of a currency pair by comparing its up movements versus its down movements over a given time period.
Volatility Indicators
Volatility indicators measure the rate of price movements, regardless of direction.
This is generally based on a change in the highest and lowest historical prices.
They provide useful information about the range of buying and selling that take place in a given market and help traders determine points when the may change direction.
Here are examples of volatility indicators:
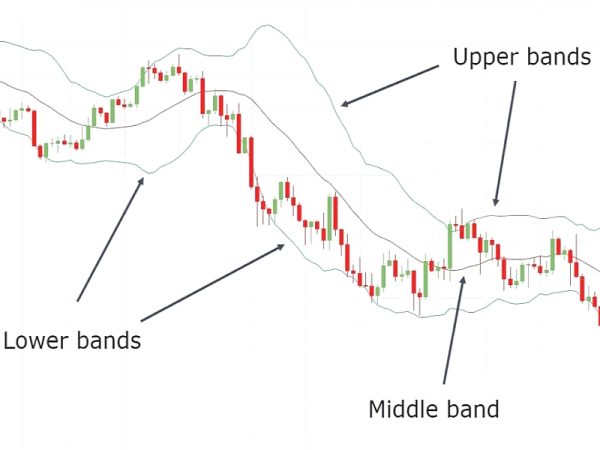
• Bollinger Bands help determine whether prices are high or low on a relative basis
• Average True Range measures volatility, taking into account any gaps in the price movement.
• Standard Deviation is the statistical measure of market volatility, measuring how widely prices are dispersed from the average price.
Volume Indicators
Volume indicators measure the strength of a trend or confirm a trading direction on some form of averaging (or smoothing) of volume.
The strongest trends often occur while volume increases.
Here are examples of volume indicators:
• Chaikin Money Flow (CMF) measures the volume-weighted average of accumulation and distribution over a specified period. The principle behind the Chaikin Money Flow is the nearer the closing price is to the high, the more accumulation has taken place.
• On Balance Volume (OBV) measures buying and selling pressure as a cumulative indicator that adds volume on up days and subtracts volume on down days.
• Volume Oscillator (VO) displays the difference between two moving averages of a security’s volume expressed as a percentage. It works on the premise that t is not the actual level of volume, but the change in volume relative to the recent past that has more technical significance.