Harmonic Price Patterns
Harmonic price patterns are geometric price patterns that use mathematics and Fibonacci levels to define precise turning points. Unlike most other trading methods, Harmonic patterns attempt to predict future price movements and also how long a move will last. The first pattern was discovered by HM Gartley in 1935 and current harmonic patterns come from the work of Bryce Gilmour and Scott Carney who ascribed precise mathematical ratios to define the structures. Fibonacci ratio retracement and expansion tools are used to narrow down very precise reversal levels. It is important to note that smaller time frame patterns occur within bigger time frame patterns and non-harmonic patterns may (and likely will) exist within the context of harmonic patterns. These can be used to add confidence in the harmonic pattern or enhance entry and exit performance.
Harmonic Patterns
The similarity between harmonic and basic chart patterns is that, for each of them, the shape and structure are key factors to recognizing and validating a specific pattern. The next price movement can thus be projected with the goal of turning these patterns into profits. However, a key difference is that harmonic patterns are defined more precisely. They are 5-point reversal structures, containing combinations of well defined consecutive Fibonacci retracements and Fibonacci extensions, leaving less room for flexible interpretation.
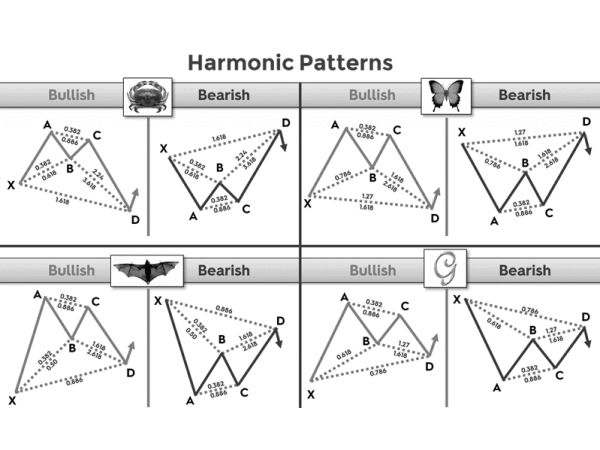
Harmonic patterns continuously repeat themselves, especially in consolidating markets. There are basically 2 types of patterns: 5-point retracement structures like the Gartley and the Bat and 5-point extension patterns like the Butterfly and the Crab. Trading harmonic patterns requires patience because, due to the specificity of the ratios, patterns that appear harmonic may not be if they don't align with the proper measurements.
Harmonic Bullish Price Patterns
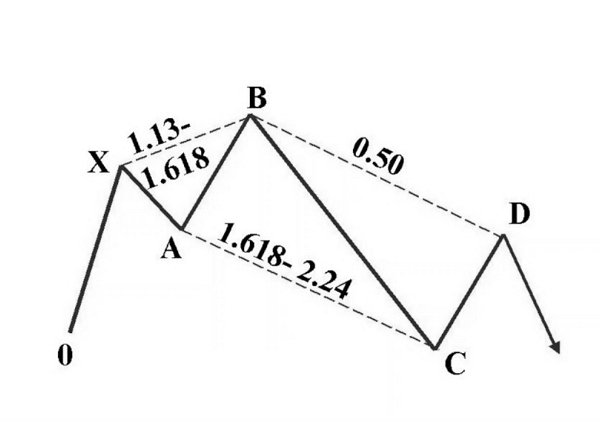
Bullish 5-0
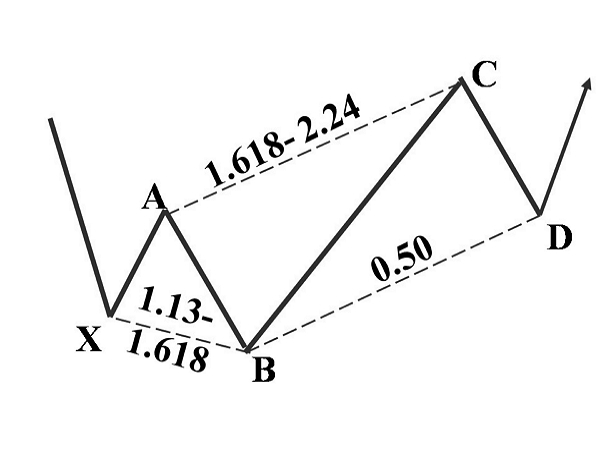
A trend continuation pattern that provides an entry after a major reversal. The pattern starts with a downtrend which comes to exhaustion and draws zigzag-like corrective movements. The BC leg is a bullish reversal that extends between 1.618 and 2.24 of the AB leg followed by a CD leg that retraces 50% of the BC leg and is equal in length to the AB leg and is the buy entry.
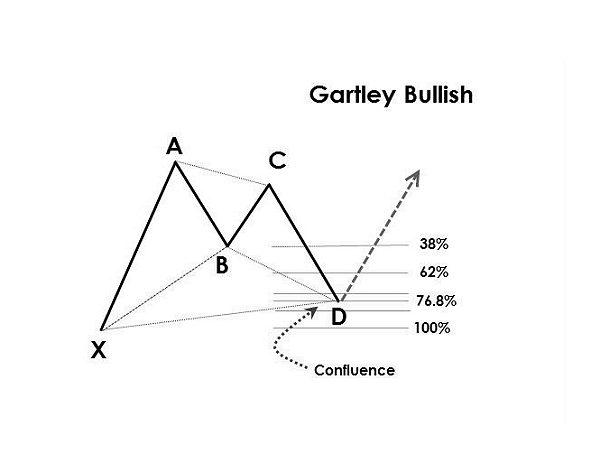
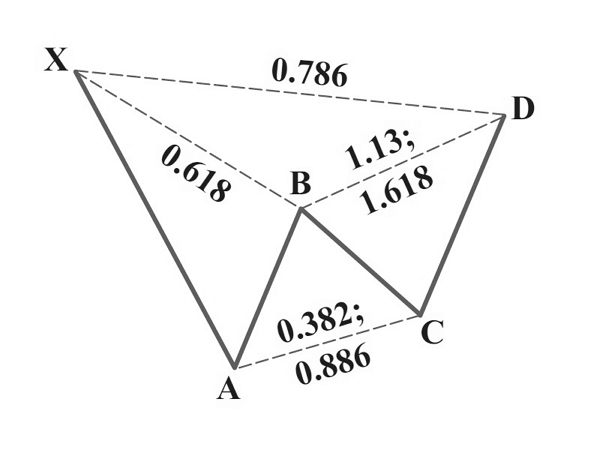
Bullish Gartley
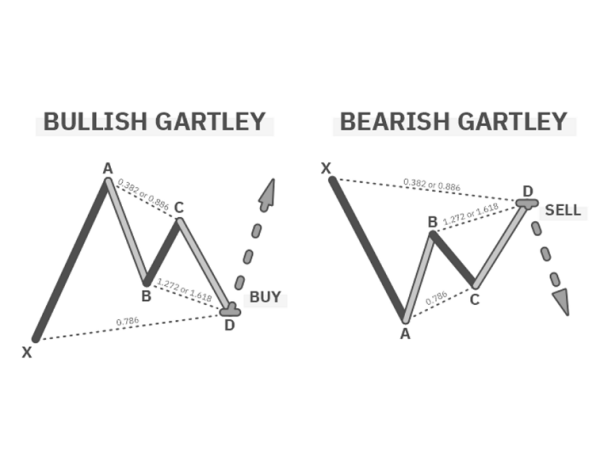
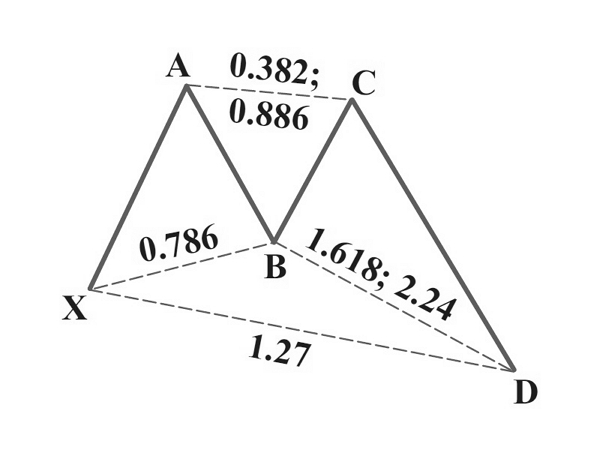
The Gartley is a trend continuation pattern first identified in 1935. The best Gartley patterns have a clear ABCD pattern, a point B that terminates at 0.618 of the XA leg, a point D that terminates at the 0.786 of the XA leg and point D is a 1.272 or 1.618 projection of the BC correction.
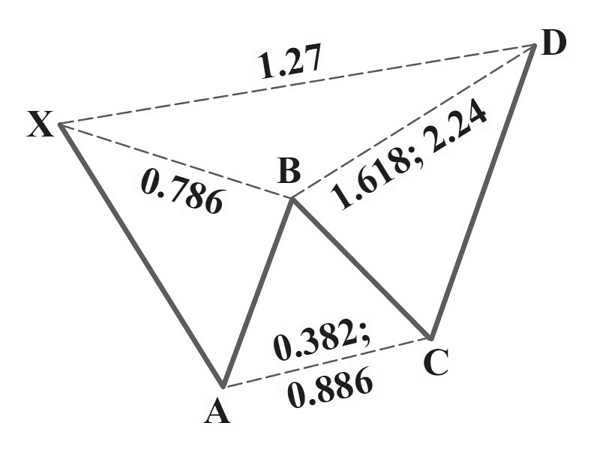
Bullish Butterfly
A bullish butterfly pattern starts with a strong XA leg higher followed by a leg lower to the 0.786 retracement, a BC leg bounce, then an extended CD leg lower that exceeds X starting point. The CD leg usually terminates at 1.27 of the XA leg but sometimes it is 1.618 of XA. CD is usually 1.618 of AB (sometimes 1.272) and must be an ABCD or alternate ABCD to be valid. Gartley's that fail as reversal patterns usually continue to Butterfly patterns before reversing.
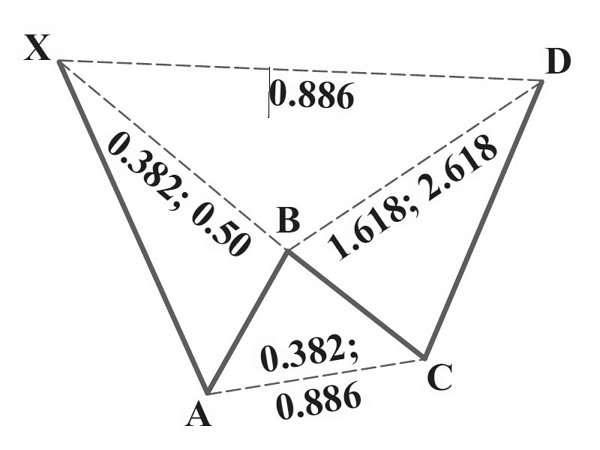
Bullish Bat
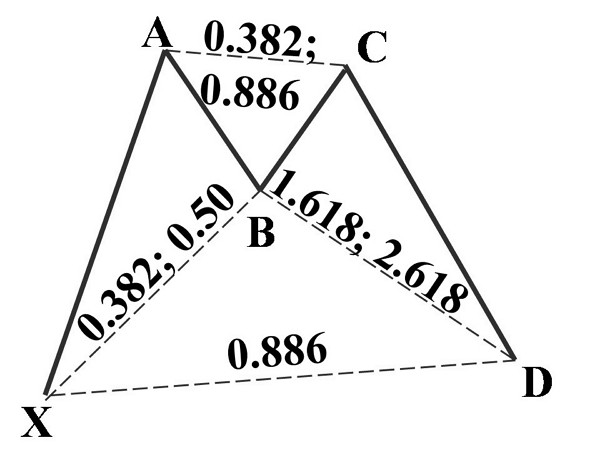
A bullish bat pattern starts with a strong XA leg higher followed by a two-wave correction lower which terminates at the 0.886 Fibonacci retracements of the XA leg. The point B retracement is to the 0.50 or 0.382 and less than a 0.618. The CD leg is extended and usually 1.27 of the AB leg. Bat patterns often retrace hard.
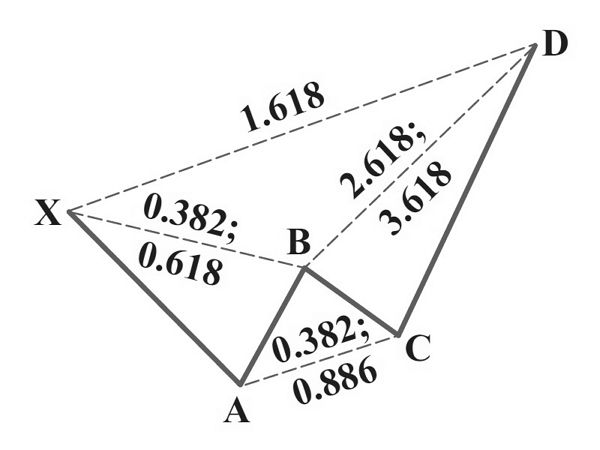
Bullish Crab
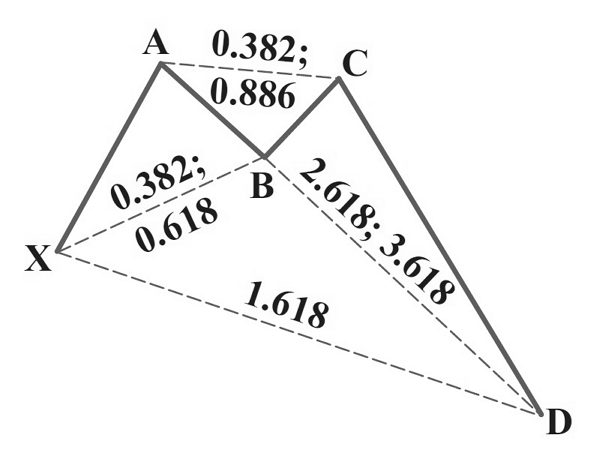
The crab pattern is another pattern where the reversal point D is beyond the X start point of the pattern. In a bullish crab a bullish reversal is retraced between 0.382 to 0.618, followed by a bounce BC and then a CD that is a 161.8% extension of the XA leg and is also a 224% – 316% extension of the AB leg. This pattern uses a very tight reversal zone and a smaller stop loss.
Bullish Shark
This new pattern is designed to identify a trend change rather than a retracement entry to an existing trend following a failed impulse AB wave. It is similar to a 5-0 pattern but without the D leg and constraints. The Point C reversal zone entry point is either at 0.886 or 1.13 of the 0-X initial leg. This pattern requires management, it is usually volatile and the first target for the trade is the 50% retrace of the BC leg which is the 5-0 entry point.
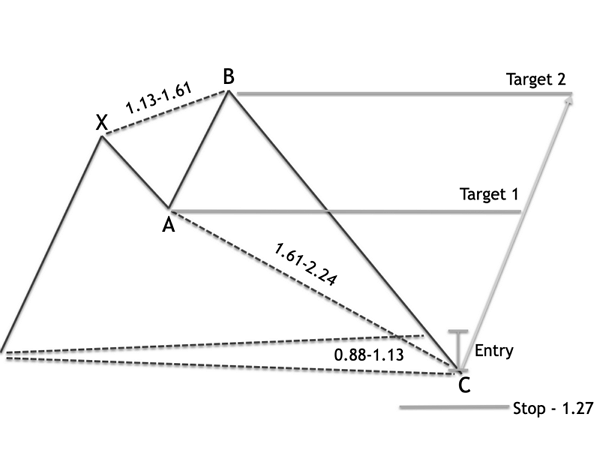
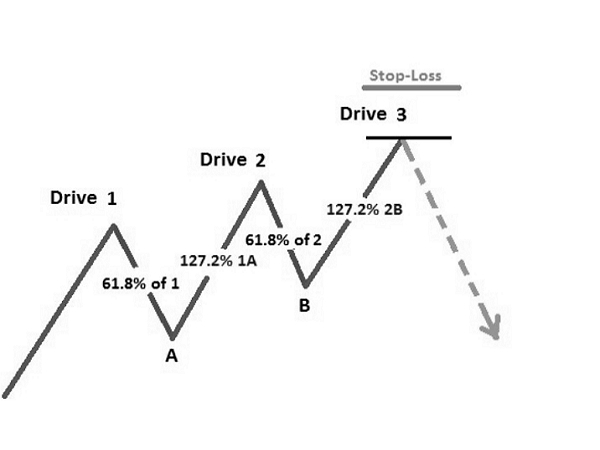
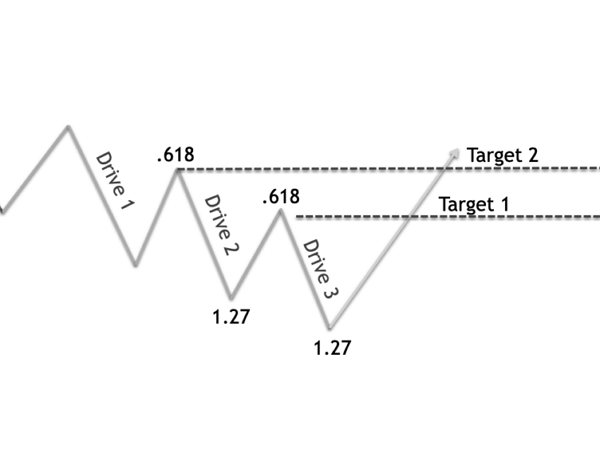
Bullish Three Drives
This pattern is similar to an ABCD pattern with en extra leg. As with the ABCD pattern it works well when each leg starts at a Fibonacci retracement of the previous leg, completes at a precise Fibonacci ratio projection (either 1.13, 1.27 or 1.618) and there is time and price symmetry in each of the legs.
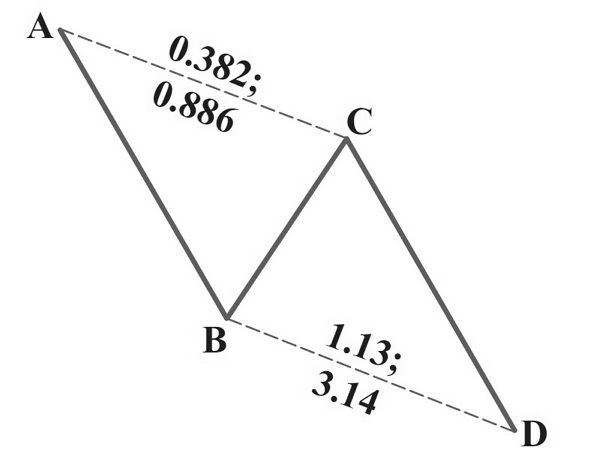
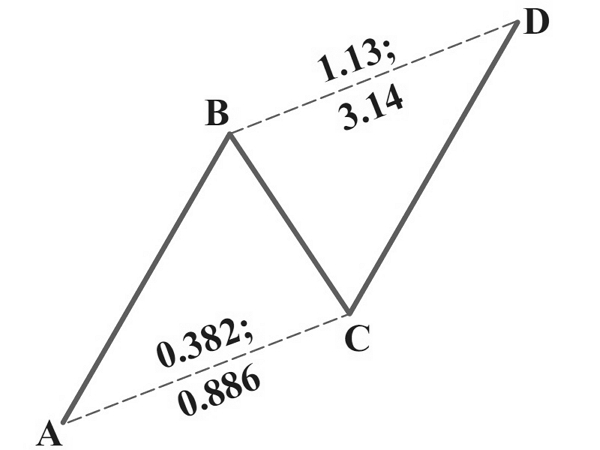
Bullish ABCD
A trend continuation pattern was discovered by Gartley in 1935. The lines AB and CD are known as the legs while BC is called the correction or retracement. In an ideal ABCD pattern, the two legs are equal in distance and time. The correction should ideally retrace to either a 0.618 or 0.786 which sets up a point D that is either a 1.27 or 1.618 of the BC correction. A 0.618 retracement at the C point results in a 1.618 BC projection. A 0.786 retracement at the C point results in a 1.27 projection to point D.
Harmonic Bearish Price Patterns
Bearish 5-0
A trend continuation pattern that provides an entry after a major reversal. The pattern starts with an uptrend which comes to exhaustion and draws zigzag-like corrective movements. The BC leg is a bearish reversal that extends between 1.618 and 2.24 of the AB leg followed by a CD leg that retraces 50% of the BC leg and is equal in length to the AB leg which is the sell entry.
Bearish ABCD
A trend continuation pattern was discovered by Gartley in 1935. The lines AB and CD are known as the legs while BC is called the correction or retracement. In an ideal ABCD pattern, the two legs are equal in distance and time. The correction should ideally retrace to either a 0.618 or 0.786 which sets up a point D that is either a 1.27 or 1.618 of the BC correction. A 0.618 retracement at the C point results in a 1.618 BC projection. A 0.786 retracement at the C point results in a 1.27 projection to point D.
Bearish Bat
A bearish bat pattern starts with a strong XA leg lower followed by two-wave correction higher which terminates at the 0.886 Fibonacci retracements of the XA leg. The point B retracement is to the 0.50 or 0.382 and less than a 0.618. The CD leg is extended and usually 1.27 of the AB leg. Bat patterns often retrace hard.
Bearish Butterfly
A bearish butterfly pattern starts with a strong XA leg lower followed by a leg higher to the 0.786 retracements, a BC leg lower, then an extended CD leg higher that exceeds X starting point. The CD leg usually terminates at 1.27 of the XA leg but sometimes it is 1.618 of XA. CD is usually 1.618 of AB (sometimes 1.272) and must be an ABCD or alternate ABCD to be valid. Gartley's that fail as reversal patterns usually continue to Butterfly patterns before reversing.
Bearish Crab
The crab pattern is another pattern where the reversal point D is beyond the X start point of the pattern. In a bearish crab, a bearish reversal is retraced between 0.382 to 0.618, followed by a dip BC and then a CD that is a 161.8% extension of the XA leg and is also a 224% – 316% extension of the AB leg. This pattern uses a very tight reversal zone and a smaller stop loss.
Bearish Gartley
The Gartley is a trend continuation pattern first identified in 1935. The best Gartley patterns have a clear ABCD pattern, a point B that terminates at 0.618 of the XA leg, a point D that terminates at the 0.786 of the XA leg and point D is a 1.272 or 1.618 projection of the BC correction.
Bearish Shark
This new pattern is designed to identify a trend change rather than a retracement entry to an existing trend following a failed impulse AB wave. It is similar to a 5-0 pattern but without the D leg and constraints. The Point C reversal zone entry point is either at 0.886 or 1.13 of the 0-X initial leg. This pattern requires management, it is usually volatile and the first target for the trade is the 50% retrace of the BC leg which is the 5-0 entry point.
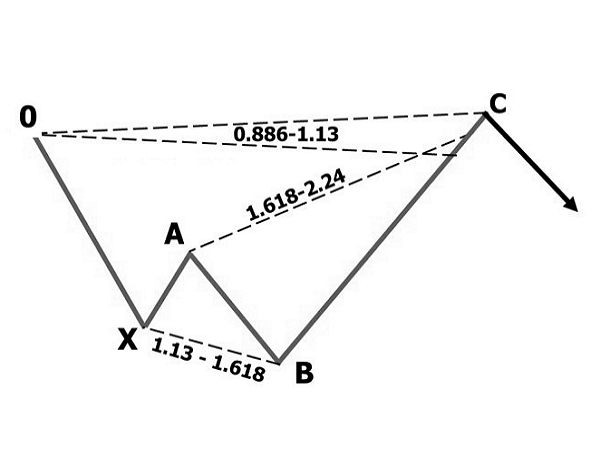
Bearish Three Drives
This pattern is similar to an ABCD pattern with en extra leg. As with the ABCD pattern it works well when each leg starts at a Fibonacci retracement of the previous leg, completes at a precise Fibonacci ratio projection (either 1.13, 1.27 or 1.618) and there is time and price symmetry in each of the legs.