Indicators and Oscillators
Relative Strength Index
The Relative Strength Index (RSI) is an indicator that shows momentum. It measures the magnitude and timing of up or down moves of an instrument. The definition is the following:
RSI = 100 – 100 / (1+RS)
(Where RS is equal to the average gains divided by the average losses for that specific period)
The RSI is a relatively simple indicator, but a very powerful one. RSI values below 30 are considered to be oversold (i.e. the instrument may be undervalued) and conversely RSI values above 70 are considered to be overbought (i.e. the instrument may be overvalued).
The RSI can often “lead” the price action of the underlying instrument, in which case it’s said to have RSI divergence. For example, if an instrument’s price is going higher but the RSI is dropping, that often indicates that the instrument’s price will soon follow lower.
Fibonacci Retracement & Extension
Fibonacci retracements and extensions are mathematical ratios used to derive resistance and support levels. They are very popular with traders and are also used to predict the extent of corrections or pullbacks in technical analysis. As a side note, harmonic trading patterns are almost exclusively based on them.
The basic Fibonacci retracement ratios are: 0%, 23.5%, 38.2%, 50%, 61.8%, 100% and the most popular ratio is the 61.8%.
Fibonacci extensions are used to project an existing move to another point on a chart and hence connect 2 separate moves with each other. Traders frequently use them in most forms of technical analysis and especially those using harmonic patterns and Elliot Wave theory. Classic examples are measuring the equality of 2 legs of a move AB = CD for harmonics or the projection of a Wave 1 to Wave 5 expecting wave 5 to be a ratio of Wave 1 (usually 61.8% or 100%) for Elliott Wave theory.

Moving Averages
Moving Averages (MA) are widely used indicators for an important reason: by filtering out short-term price fluctuations, they smooth out the price sequence and hence make it much clearer to see the bigger picture.
The calculation of MAs is very simple – every data point is the average of the specified number of previous data points (for example, a 100-day MA averages the latest 100 days of daily data points in order to produce the next one). There are two popular types of MAs:
Simple Moving Average (SMA) – the simple average of the data points.
Exponential Moving Average (EMA) – an average of the data points that gives more weight to the most recent points.
At ForexAnalytix we usually track the 50-day and 200-day SMAs, which are the most commonly used MAs in the market. These particular MAs are very useful indicators when looking at the medium term view of an instrument.
An important event that many analysts look for is when two MAs cross. This can often indicate a substantial change in the general trend of an instrument. The most popular of these is the “Golden Cross”, which occurs when a short-term MA breaks above a long-term MA (for example the 50-day MA crosses above the 200-day MA).

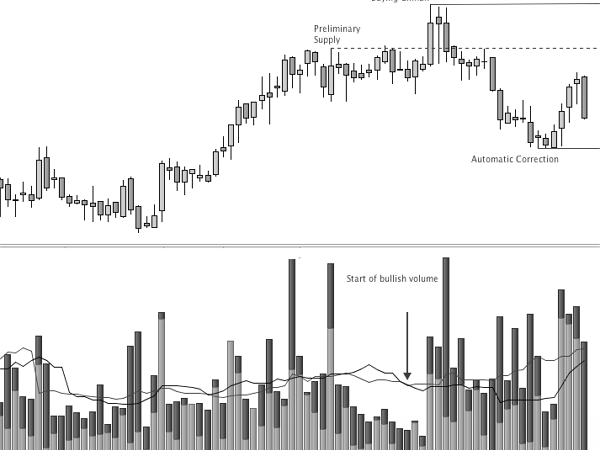
Volume
Volume is an often overlooked but important indicator. It shows the associated volume for every price change, and this can be used to interpret the relative strength of the move.
For example, a rising market should in theory be accompanied by rising volume and vice versa. Low-volume moves tend to have a higher probability of being reversed at a later stage. This is because a legitimate move higher (or lower) should be accompanied by an increased level of interest by market participants, indicating that something has changed in the fundamentals of the particular instrument.
An interesting phenomenon near market extremes is that of market exhaustion. This is where price moves are usually very sharp in magnitude, with increased volume and short duration. This reflects human psychology where investors either try to get into a market uptrend in fear of missing out, or getting forced out in a downtrend.
The Japanese began using technical analysis to trade rice in the 17th century. While this early version of technical analysis was different from the US version initiated by Charles Dow around 1900, many of the guiding principles were very similar; the “what” (price action) is more important than the “why” (news, earnings, and so on). All known information is reflected in the price. Buyers and sellers move markets based on expectations and emotions (fear and greed). So, Market fluctuates. The actual price may not reflect the underlying value.